SEO Data - All in one place
I’ve been working on a product to get all your data in one place for a year or so now. It’s ready to launch and I think it’ll make a huge difference to SEO analysis!
You can contact me here.
I'm impatient. Give me a summary.
Where can it help?
- You’re spending ages on reporting. You have to provide daily and weekly reports, you need to pull different data sources together. It’s a hot mess of Excel and Google sheets.
-
You’re completing a complicated bit of SEO analysis. You realise you’ve made a wrong assumption about your data and you need to redo all the calculations. Another wasted day.
- You finish the work and your boss loves it. He asks you to do it again for another domain. Which Excel sheet was the right one again?
- A migration has gone horribly wrong. You need to find out why. You want to dive into the keyword rankings, but it’s split across two separate search consoles. You need to combine domain1.com and domain2.com. That’s hours of spreadsheets, copy paste and VLOOKUPs in front of you.
- You've got a large site and technical SEO issues. Crawl data is going to get you some answers. But to properly uncover what Google is doing and prioritise properly, you need log data. The formats are a nightmare, there are 10s of GBs of data. You’re not even sure it’ll fit on your hard drive.
In a nutshell, this is going to make a real difference anywhere working with data is hard and time consuming.
How does it work?
It’ll take all your:
- Search console data
- Log data
- Analytics data
- Link data
- Rank data
- …. (And anything else you want).
And create your own SEO data hub.
Then we'll work with your team, to make sure they understand all the ins and outs of the data and what they can now do.
Even better we've got a front-end platform, to help make this all easier.
If you’re already convinced, get in touch!
Otherwise let me talk you through my thought process and why I think it is a problem worth solving.
We have a thirst for data
We thrive on data in SEO. Search engines are black boxes and you need data to be able to excel in your job (pun not intended).
To make better decisions, respond to changes and be effective, you use many different kinds of data.
- Analytics
- Search console
- Rank tracking
- Backlinks
- Logs
- Crawls
And you don't just need this for one domain. You need it for many.
Even for people who have a "single" website there is always more complexity.
- Old domains which got migrated.
- Multiple TLDs (.com, .co.uk, .es, .de).
- Sub-domains.
- Sub-folders that are separate websites. E.g. For many e-commerce websites, their blog is actually on Wordpress, even though the rest is on Magento.
The best decisions come from multiple pieces of data
Then you need to bring all that data together.
Let's look at some common SEO problems and see how you put those data sources together to get good answers.
A migration has gone badly. You want to understand why
It might be simple. Someone made a giant mistake, you spot it after one crawl and you're done. But that usually isn't the case. There will be lots of small problems and you'll want the data to dig into.
What data?
- Traffic data for both domains.
- Log data for both domains (or crawl data if you haven't got logs)
- Backlinks for the both domains.
And that get's us some really interesting insights. We can examine down to a keyword level what happened in our migration.
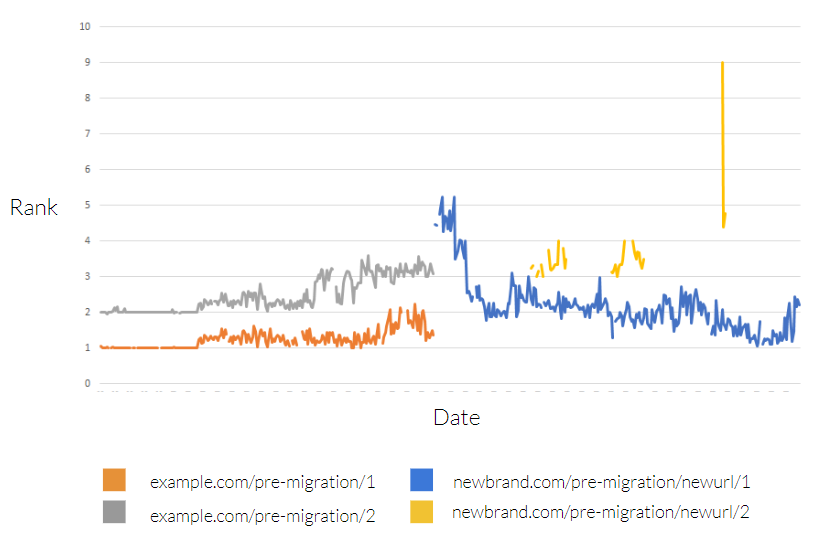
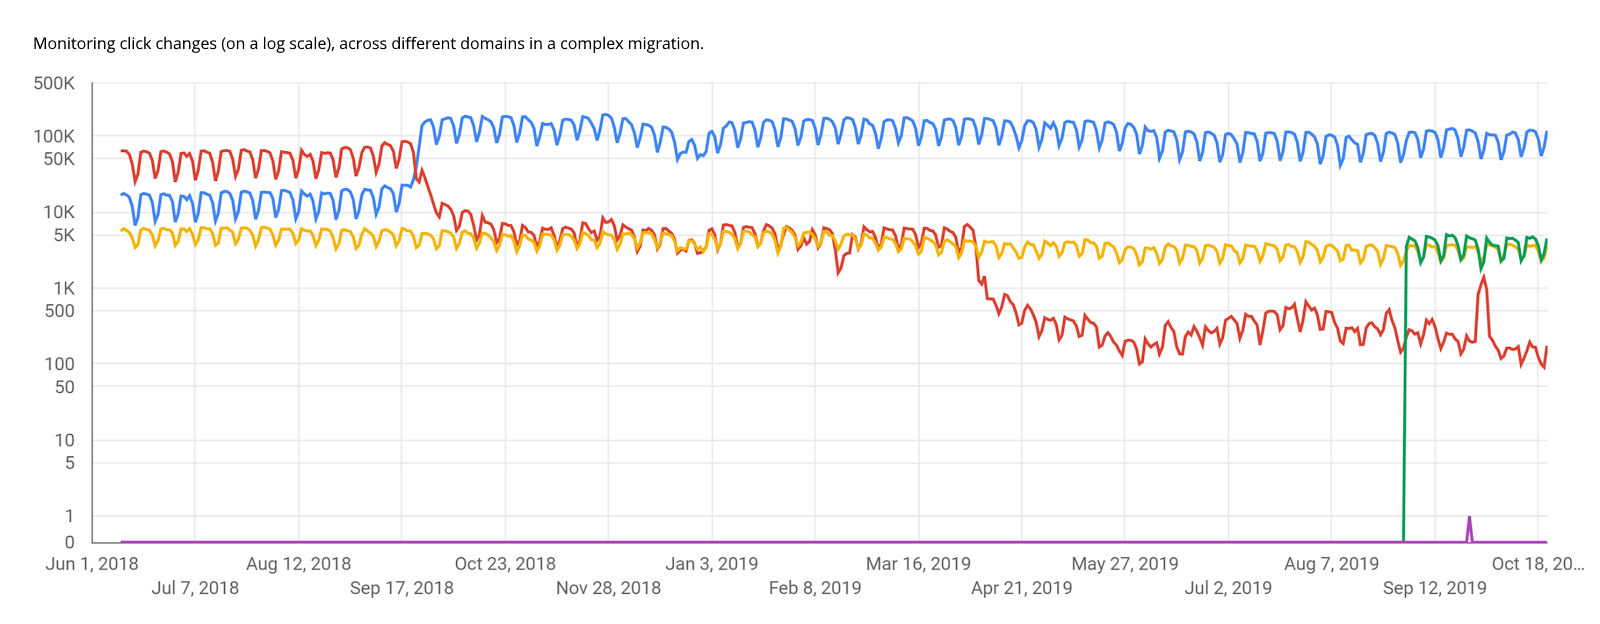
Or look at how clicks move between domains as we migrate.
Measuring the impact of a change
You're making a change on our website, how do you measure the impact?
Measuring SEO changes is notoriously hard so you often end up looking at multiple different data sources to try and pull together a picture.
- Traffic data
- Rank tracking
- Log data
Traffic data is easily misled by seasonality and other branded marketing activity. Rank data, doesn’t tell you how valuable a keyword is, only that you appear for it and log data tells you if Google has crawled, but nothing about your performance.
It’s only by bringing these together can you get a proper picture.
Technical SEO audit
For a really basic audit people will often just pull reports from a crawler, package them and send them to their client/boss. That’s never helped anyone, you can do better.
You'll definitely need:
- Crawl data for your "one website"
But where a technical audit really lives and dies is with prioritisation and that means more data. What data?
- Log data
- Traffic data
- Backlink data
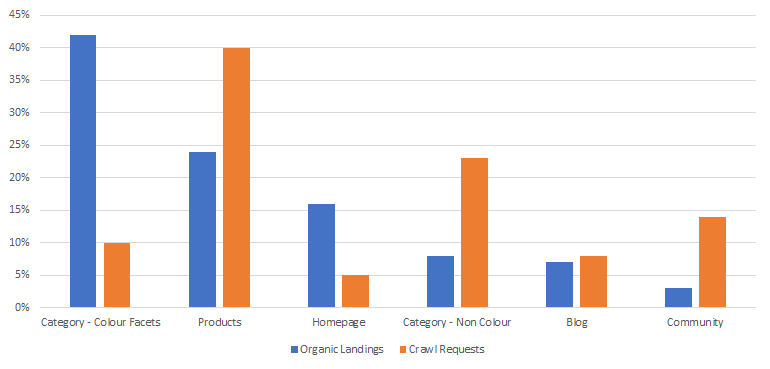
An initial top level summary looking at organic landings vs Googlebot crawl requests.
And the list goes on:
- Prioritising new website features.
- Building reports.
- Market size analysis.
- Competitor analysis
- ...etc.
Working with lots of data is just part of our jobs.
But pulling all the data to make this work is awful
It is hard repetitive work. You run into all sorts of different problems:
Getting all the data: Tools like Google Analytics & Search console don't really give you all the data unless you're using the API.
Too much data: If you do get a lot of data (hello log files), then Excel and Google sheets quickly become slow and hard to use.
Did you know that if you need to delete rows in an Excel table you should clear any filters first, because it’ll run far quicker? No, obviously not. And you shouldn’t have to. Stop putting up with this.
Sampling: Google analytics, search console, they all sample. If you're not careful about how you get the data you'll get sampled data and wrong answers.
Doing the analysis itself is painful
Then you get all the data and you’ve got to do that analysis in a spreadsheet. Are you ever surprised that people make mistakes in spreadsheets?
All our work happens in a tiny box
We have an entire screen, but we do all our work up here.
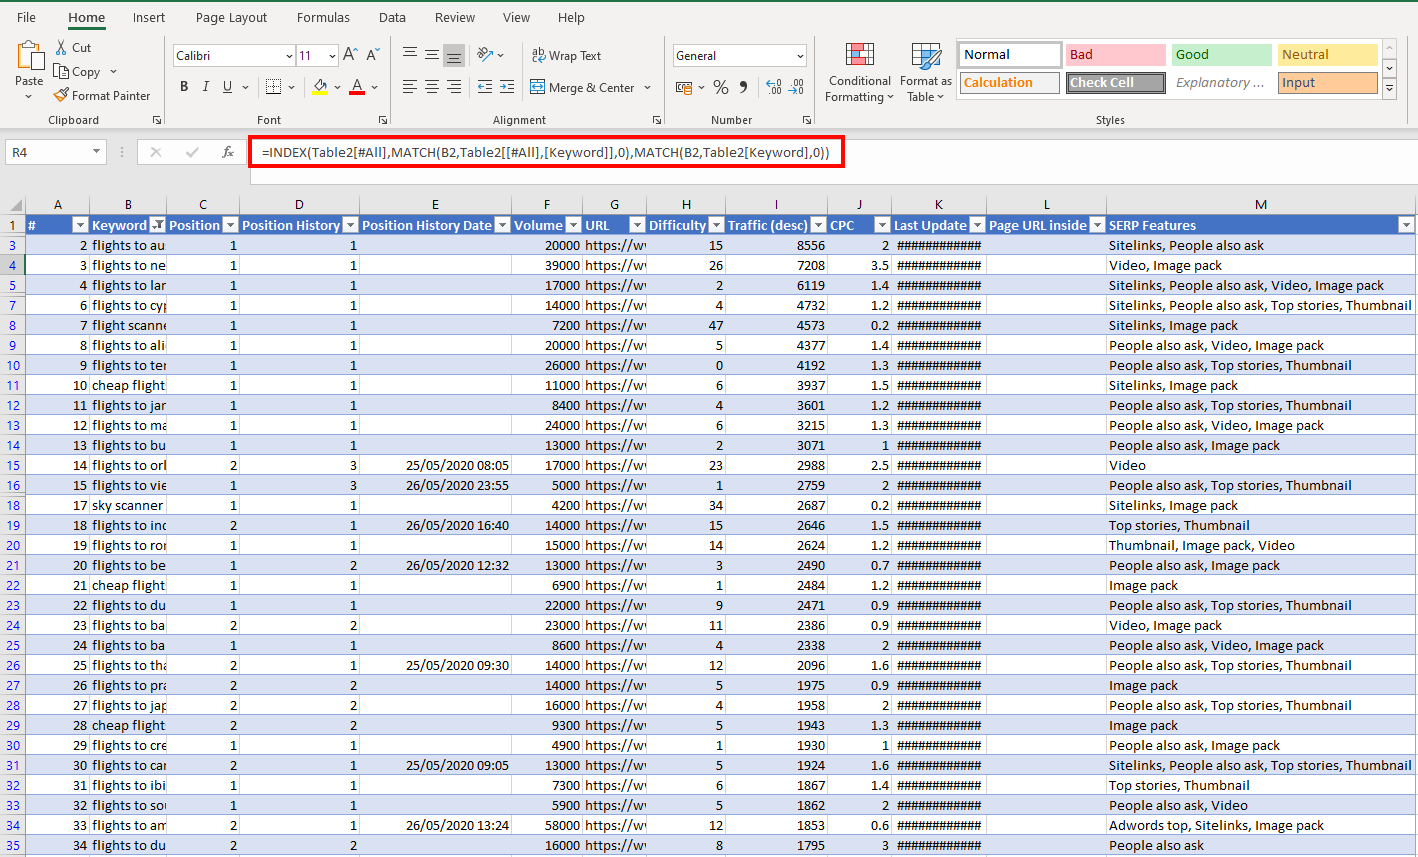
And the formula’s themselves often just reference letters and numbers
= E2 _ $O$3 _ VLOOKUP(2, Table2[#All], 3, FALSE)
To understand a spreadsheet formula, you’ve got to look up each individual part of it. (And do it all in a tiny box.)
And across multiple spreadsheets
When you’re trying to figure out that particular CTR calculation, you realise the numbers have come from another spreadsheet.
=VLOOKUP([@Position],ctrgraphonlybrand.csv!$A$1:$C$43,3,FALSE)
Was that the latest version? Where is that file? Do I need to update those numbers?
It’s horrendous. It's a miracle we ever get anything right.
We need to repeat the analysis
Finally when you've done all that and completed the analysis. You have to do it again and again and again, for any number of reasons.
- You've got weekly reports.
- You've got a piece of analysis that needs to be repeated for a new domain.
- You realised some of your numbers were wrong and now you need to redo all your calculations.
Either you're going from scratch, or you're back to your spreadsheets trying to work out which was the latest:
final analysis 1.xlsx or final analysis 2.xlsx
How can we make this better?
What's the answer to this?
- Have all our data pulled together and ready to be analysed.
- Have our data in a place where we can scale to any size and we can minimise sampling.
- Have templates to let us run common pieces of SEO analysis without thinking.
- Have the ability to ask more complicated questions, without spending hours of getting data in the right format.
I've done it for several companies and now I'm excited to launch it as an actual product.
What is the product?
Let’s break it into two pieces:
1. Putting all of your data in BigQuery.
We automate downloading all the different data sources and loading it into BigQuery.
Loading this data, solves a lot of our problems:
- We’re getting all the data: Because we’re pulling from APIs, we’re not limited by what we can get from the UI.
- Our data isn’t sampled: Thanks to automation, we can also draw down data in a way that prevents sampling.
- We can handle any size of data: BigQuery can handle any size of dataset. We won’t ever run into scale issues.
- All the data is ready to go: We don’t need to go to three different places to download all our data. It’s all up to date and ready to go, in one place.
Then we move onto the second part.
2. Working with the data
We need to be able to run analysis on this data.
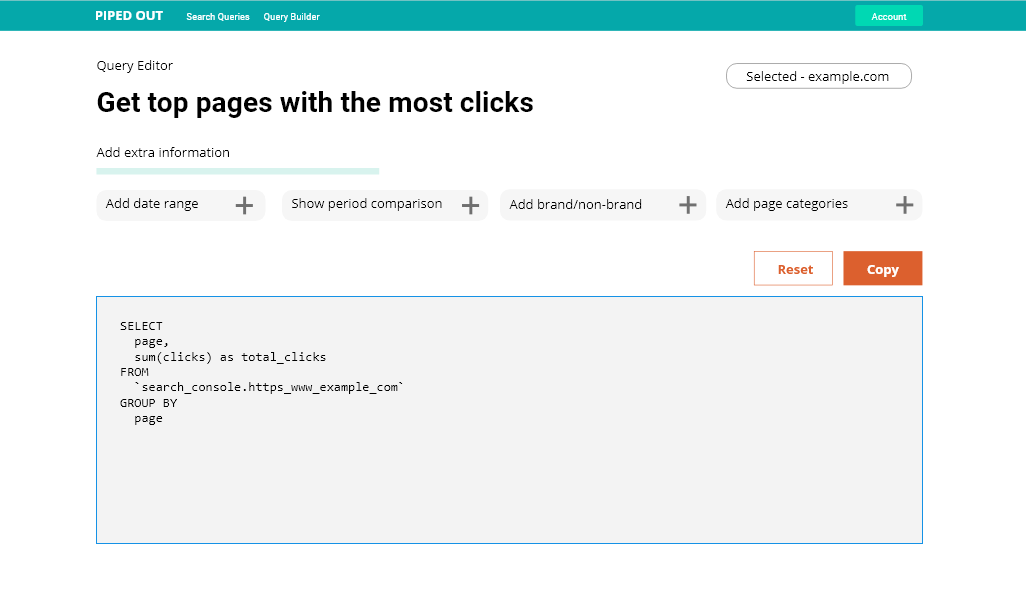
Having it in BigQuery already means we’re well set-up to go. And the platform I’ve made contains shortcuts for making queries and lots of pre-made queries.
Together they solve the rest of our problems:
- Writing formulas is easier: In BigQuery, we write our formulas in a nice large box, with autocomplete and friendly names for all our columns.
- Repeating our analysis is really quick: Once you’ve written a query, you can re-use it over and over again, just changing the dates or the website. It’s one click.
- You can use pre-made queries: Even better you can use a pre-made query. We’ve written a lot of those for you and you can just copy and paste.
- More powerful analysis: BigQuery allows us to do more powerful and complicated analysis than we could manage in Excel.
What now?
I’ve been talking about this kind of thing since 2016.
I’ve done it for a number of different companies and it’s really changed how they’ve worked and vastly improved their analysis.
That’s true for in-house teams, but also for agencies.
The first company I got to start doing this work for was Distilled and I’ve got to see first hand how useful it’s been.
It’s never been a formal product until now, so I’m really excited to finally be able to talk about it.
If you’re interested please get in touch!