How (& why) to use Python for basic data analysis instead of Excel
If you find yourself doing a lot of data analysis in Excel, moving to Jupyter notebooks and python is one of the best things you can do for your career.

Why bother?
When I started I didn't see the value in it either. Why bother? I was quick in Excel. I knew all the shortcuts. I was fast and code was hard.
But moving from Excel to Jupyter notebooks and python has a huge number of benefits, your work becomes:
- Repeatable: Code can be generic, you can easily write a standard piece of analysis and then re-use it in multiple different situations.
-
Understandable: If you perform a piece of analysis in code, the code will show you what has been done. Remember in high school, where people will tell you to show your working? It's just as important now. It's often not perfect, but it does mean:
- Revisiting work you've done months ago, is easier to follow
- If someone gives you a piece of analysis, you can follow how they've got to the results.
- If you need to go back and re-calculate parts of a piece of analysis, you just need to alter a section of code.
- Scalable: Excel struggles with large amounts of data. Python doesn't. There is still a limit, but now we're in the millions rather than the tens of thousands.
- More Powerful: Things that are trivial in Python can be exceptionally hard in Excel (for example using text fields in the value part of a pivot chart).
- Applicable outside data analysis: Learning how to do data analysis this way, will make you more comfortable with code, wherever else you encounter it.
But unlike Excel, it doesn't have lots of nice shiny buttons and there's no nice GUI. Many of the tutorials are also often complicated and aimed at people with a greater knowledge of code and data analysis than I had at the start.
A tutorial for learning data analysis with pandas and jupyter notebooks
So I made a tutorial for beginners. I often work with Google ranking data, so we're going to use a sample extract from STAT and walk through some common tasks. By the end, most of the tasks you'd do in Excel we should've covered.
This is the tutorial for beginners, that I needed when I started. You'll need to install Python and set-up Jupyter Notebooks first, once you've done that, then you can find the workbook and all associated files in this GitHub repository.
If that all sounded like gibberish then, here are some more detailed instructions:
- Open the Github page.
- Download the folder as a zip file (see screenshot below)
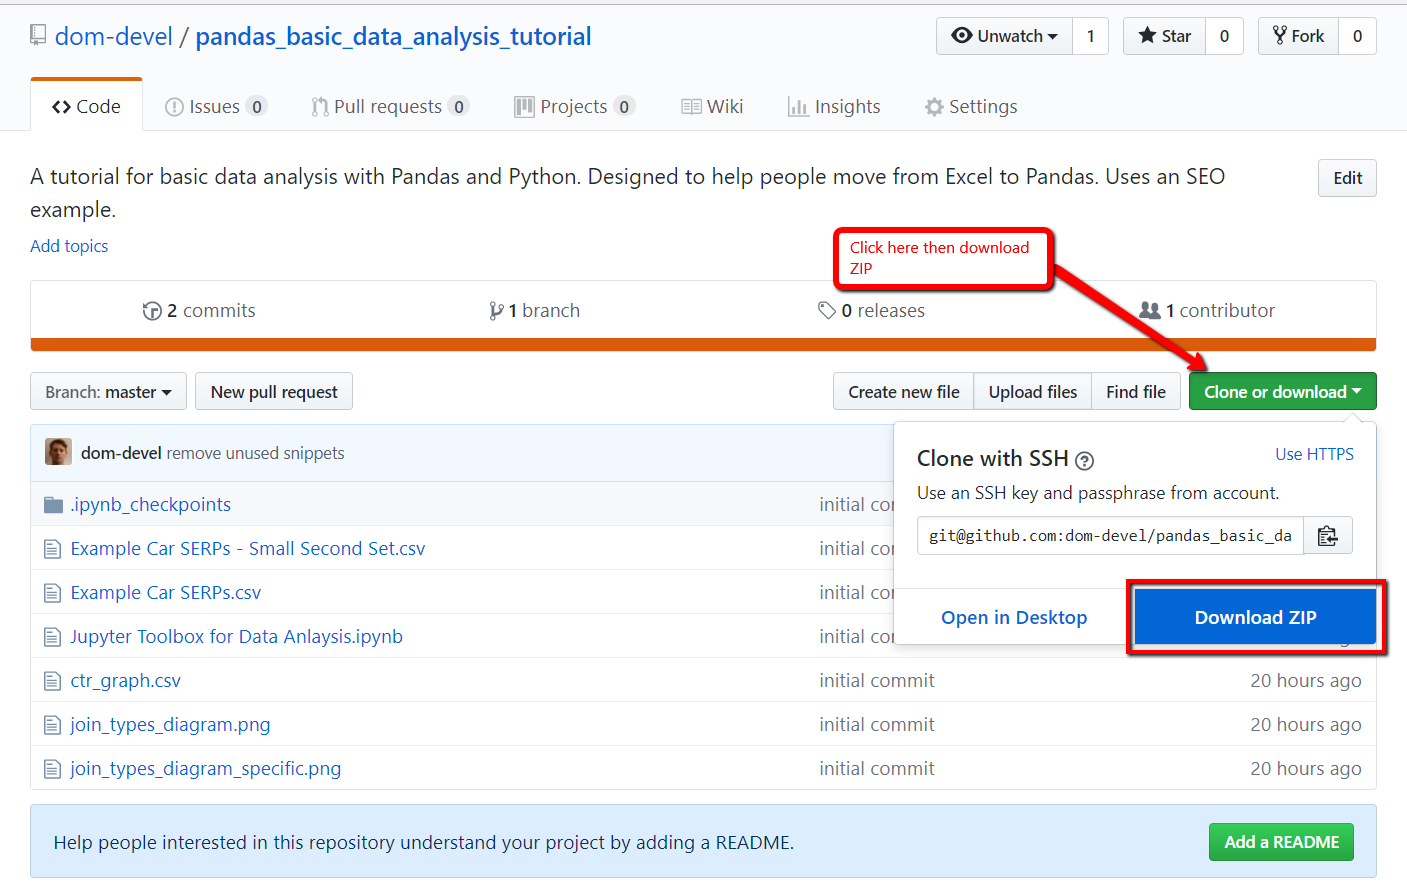
- Extract the files into a folder.
- Open the the Jupyter notebook in the folder with the jupyter notebook browser. You can see instructions for how to run jupyter notebook here.
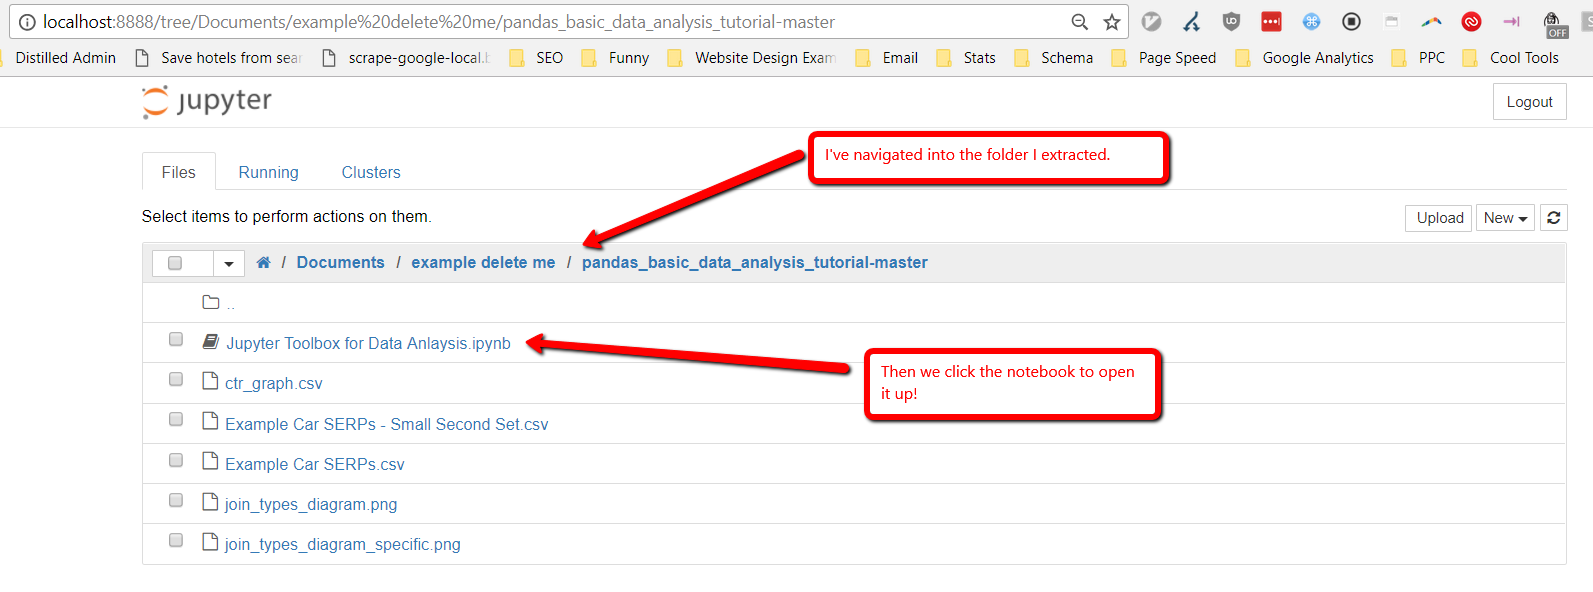
- Work through the notebook, the rest of the instructions should be in it.
Questions?
Fire away in the comments, there are almost certainly things I've missed as well bits that could use more explanation. Leave them below and I'll do my best to answer them.
