How to get un-sampled Google Analytics data with python (& without)
Un-sampled Google analytics data, wherever you need it.
Eventually in your marketing career you might find yourself working a website, where it's so large that Google analytics becomes difficult to use without sampling.
They also might not have shelled out the hundreds of thousands a year for premium, to get around it.
What can we possibly do?
We're going to explore all the messy details, a couple different options and then go through some python we can use to get all of it. I use this script/library a lot.
What is Google analytics sampling
When you have too much data, Google analytics won't return all of it. In the case below it's only using 52% of our data to make the reports. It's because we have over 500K sessions in our date range.
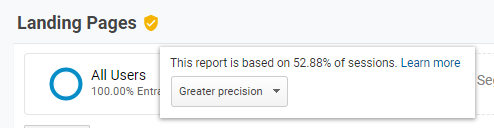
It's tried to pick a representative sample so we still get an answer, but without Google having to do a huge amount of work & taking forever.
Sounds pretty reasonable right?
Problem is that sometimes sampling can throw your data off really badly.
We'd far prefer our analysis was right and it just took a little longer.
Even worse there are multiple kinds of sampling.
Eugh I know. The worst.
What is cardinality?
Cardinality is the second kind of sampling.
Lets suppose you have a website with 6 million pages. When you open a report GA won't show all of those 6 million pages. Instead you'll see a smaller number of pages and everything below a cut off gets put into (other).
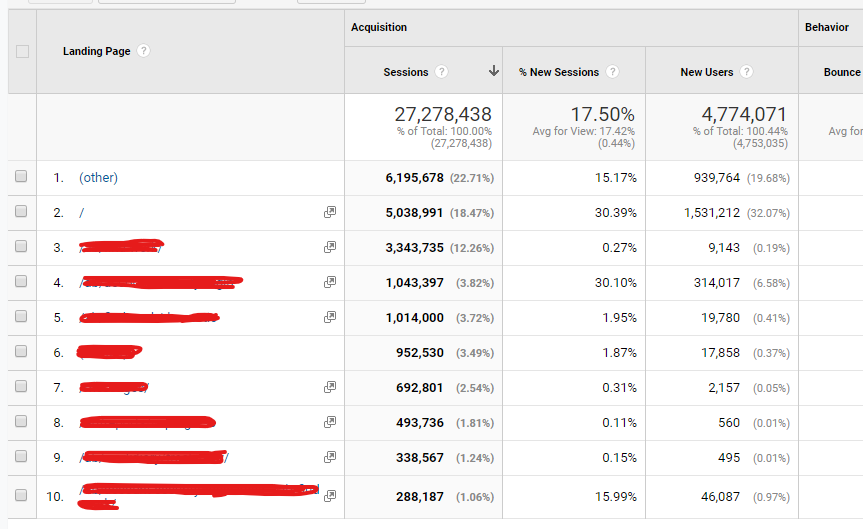
Specifically if you use a default table (i.e. one that you get to by clicking on a link in the interface) and it has more than 50,000 unique rows per day then any rows after 50,000 will all be bundled up into (other).
In practice you'll usually find that if you have more than 100K rows for a time period some of them will be rolled into (other), because no websites top pages totally change from one day to another.
You are technically getting all the metrics (your total sessions will be correct etc.), but you're losing the dimensions (extra pages are being rolled up into one), so we're calling it sampling.
I've actually simplified this slightly, cardinality is more complicated than that. I've put more information in the last section if you're unbearably curious.
When does Google analytics sample?
TL;DR: Pre-aggregated tables never sample, but do have cardinality issues. Custom queries do sample and have cardinality issues.
Did that make no sense? Don't worry let's dive into the details.
When you ask for data with Google analytics there are two kinds of queries it makes:
- Queries to pre-aggregated tables.
- Queries off the raw data.
Any standard report (I.e. one you can click to in the interface) GA is pre-aggerated. E.g.
- Behaviour > All pages
- Acquisitions > All Traffic > Channels
Google has calculated it before you ask for it, so it can return the answer quickly.
But as soon as you ask for any customisation e.g. a Custom report or adding a secondary dimension, then Google can't use it's pre-calculated reports and it goes to the raw data.
Pre-aggregated tables
- These never sample.
- They do have cardinality issues.
Queries off the raw data
- These do sample. The threshold for the free version is 500K sessions for the date range selected. When you hit that, it will sample.
- They don't usually have cardinality issues. You get 1 million rows for your time period.
How can we get around sampling & cardinality?
How to get around cardinality
Cardinality is often an issue when you have a user generated template which can generate vast numbers, e.g. job adverts or user profiles.
If you're working in advance
The most common way to get around this to:
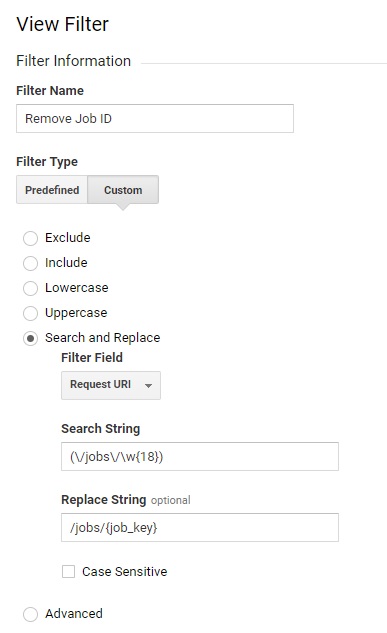
- Create a new view.
-
In that view create a filter which replaces all pages of a certain path with a generic one. E.g.:
- Before:
/job-advert/1 - After:
/job-advert/{id}
- Before:
This won't get you historic data, but it does usually solve the problem going forward.
If you're working with already saved data
Adding in a secondary dimension will create sampling, but remove cardinality and allow you to hit 1 million rows. That might solve your problem.
How can we get around sampling?
Pay for GA premium
Shell out all the dollars and un-sampled data is yours. You'll be able to download un-sampled reports and everything will be good.
Only use the pre-aggregated reports for big time periods
If you can restrict yourself to only pre-aggregated reports, then this problem goes away.
But lets be honest. We probably won't do that.
Download for a smaller a period manually
Rather than downloading data for an entire date period, we split it into groups.
So we might download a 4 weekly reports to create a monthly report. Now we're getting somewhere.
You can have an intern run this report for every week and then combine then together. You could do some cool stuff with Google Analytics Sheets plugin.
Download for a smaller a period with python
But we'd quite like our interns to be learning rather than wasting time with pointless reports. So how about some python so we can do it all in one click?
I've published a module that will download the data day by day. That means we can download up to 15 million sessions a month.
A lot better than the 500K we can get in the interface and we can get it really easily.
How to set up some python to download unsampled GA data.
1. Setting up python
Past Dom coming in clutch. I've already written how to setup python.
We could be joining it with crawl data, getting it for a long period of time for a large website, trying to avoid cardinality or any number of things.
2. Installing the python library
We need to install the python library: daily-google-analytics-v3.
I've written about how to install python modules here.
3. Download our example jupyter notebook
Head to our git repo for daily ga data.
Then download the zip.
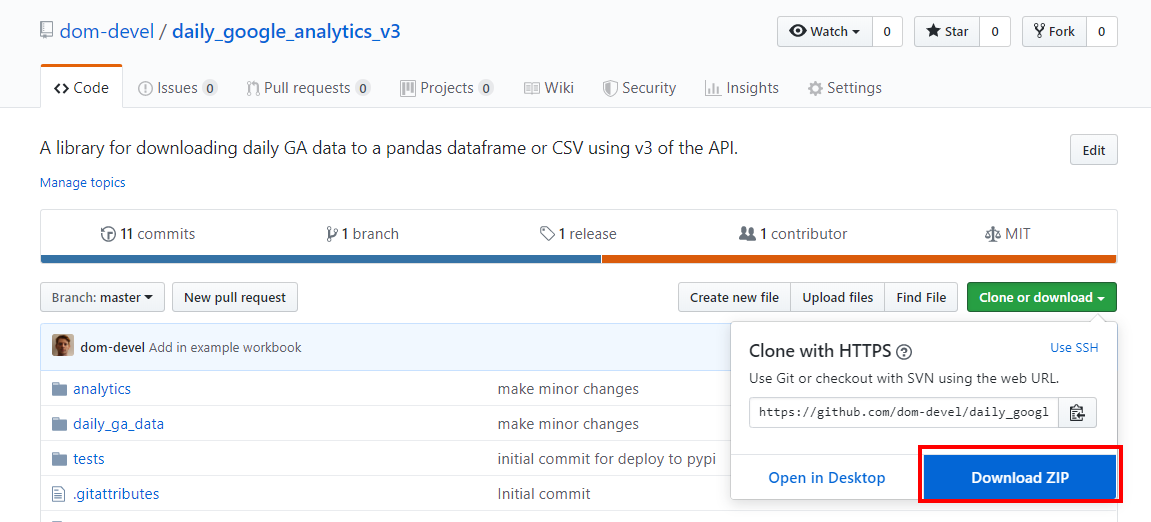
We then need to extract the notebook from the zip into just a normal folder. I do that with WinRAR.
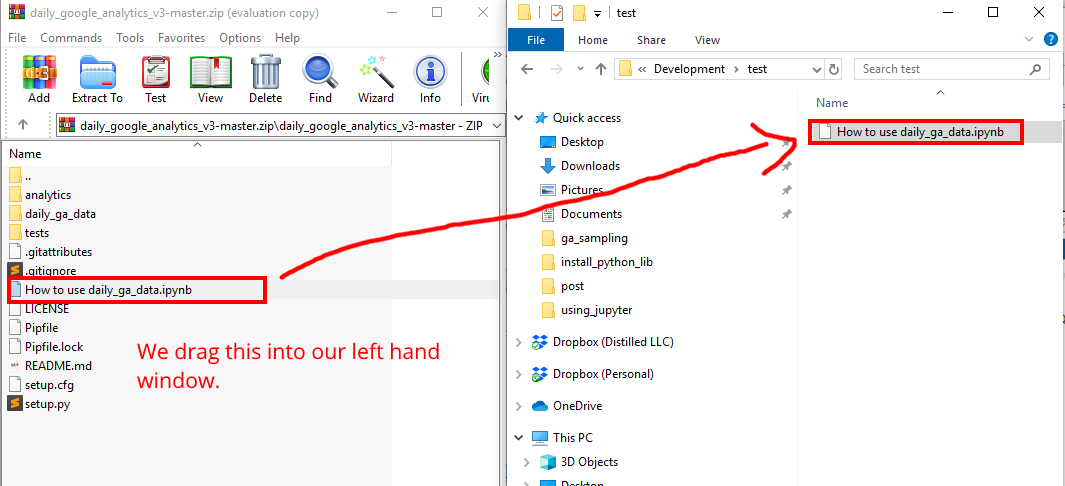
4. Open our example juptyer notebook
Not sure what jupyter notebook is or how to use it?
Don't worry past Dom has us again. I wrote a guide for getting started with jupyter notebooks.
We want to find the notebook we just downloaded and run it.
5. Turn on the GA API
We're then going to need to turn on the API to use it.
Head to the following URL and sign in with your Google account.
Then we need to create a project. There should be prompt. I usually call it something like "Local Data Analysis". You shouldn't need to set-up billing.
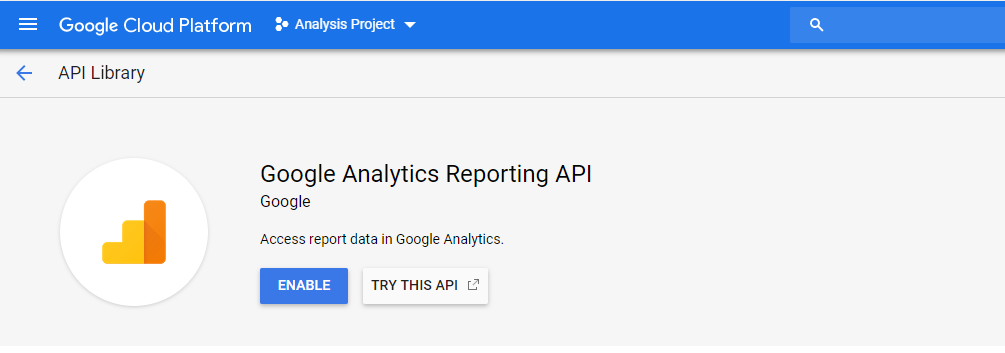
Then we go to the API screen.
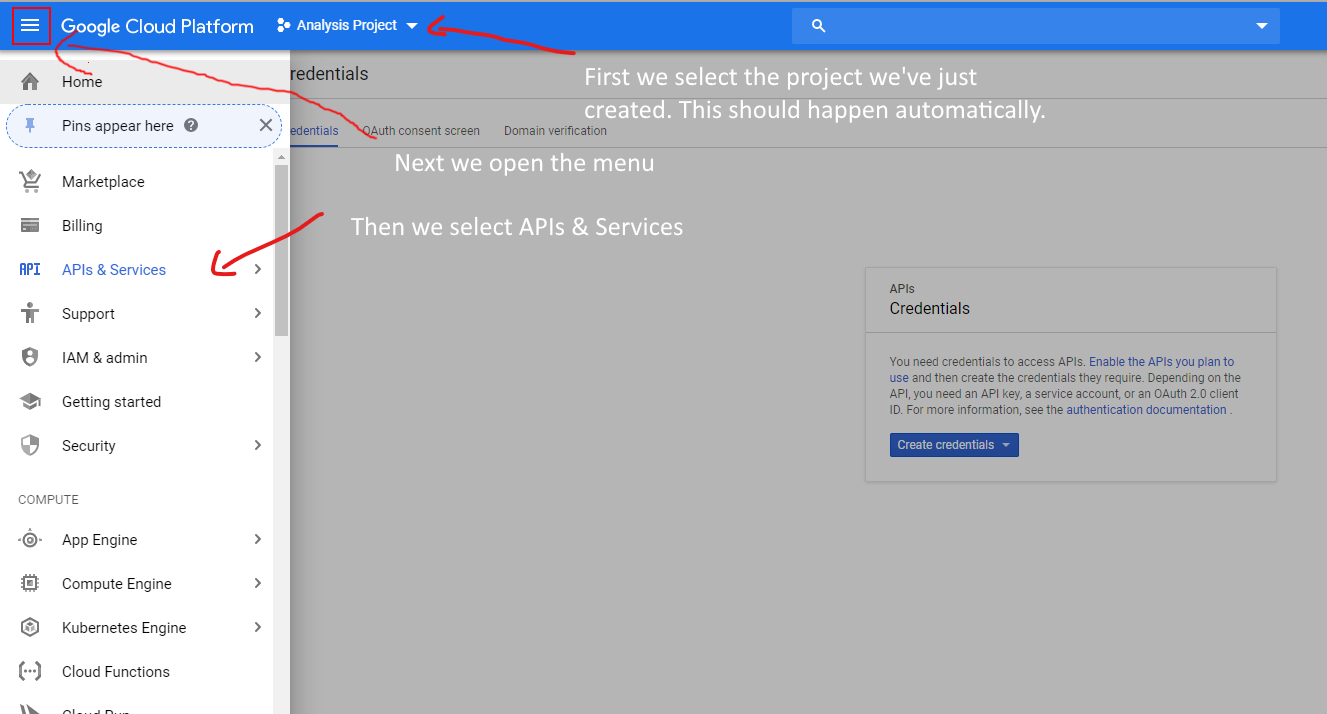
And ask to turn on APIs.
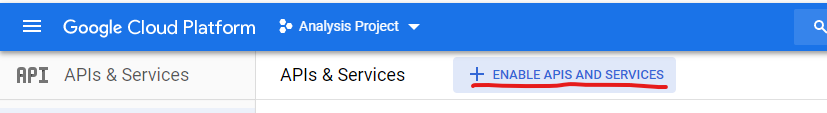
We select GA.
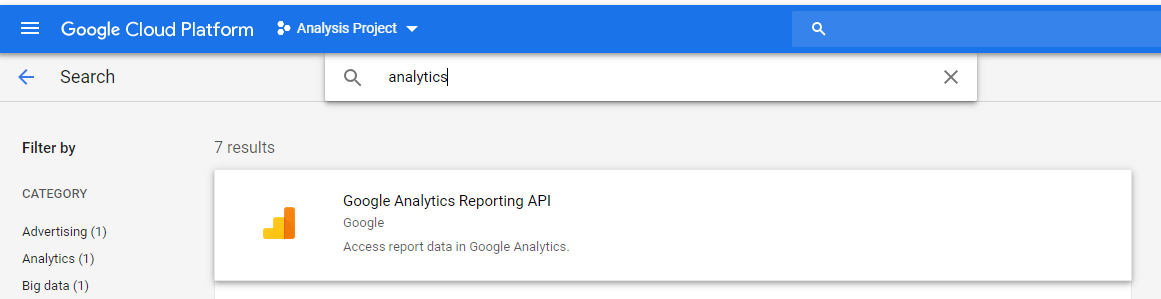
And enable it.
Now we've turned
Store it somewhere safe and copy the path to that location.
6. Get an API key
An API key is sort of like a password and if we're using the Google analytics API ourselves, we're going to need one.
We're going to go back to API menu button and select credentials which should give us this screen.
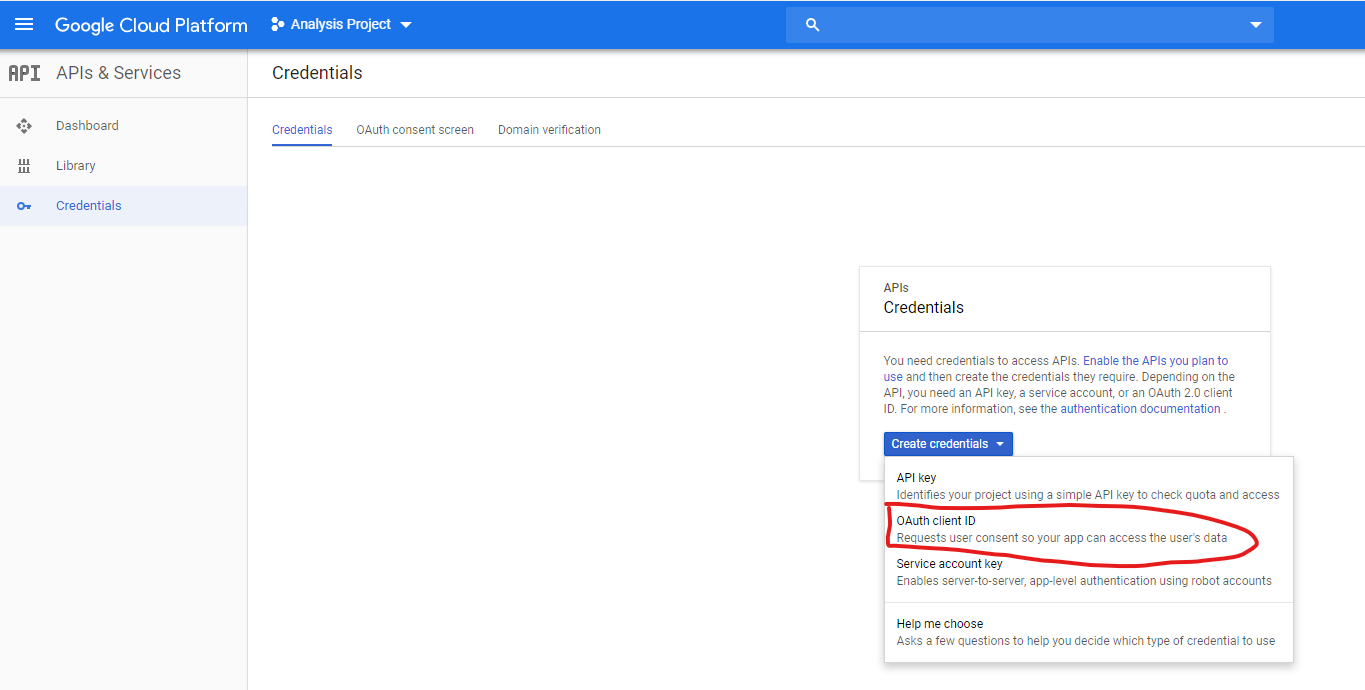
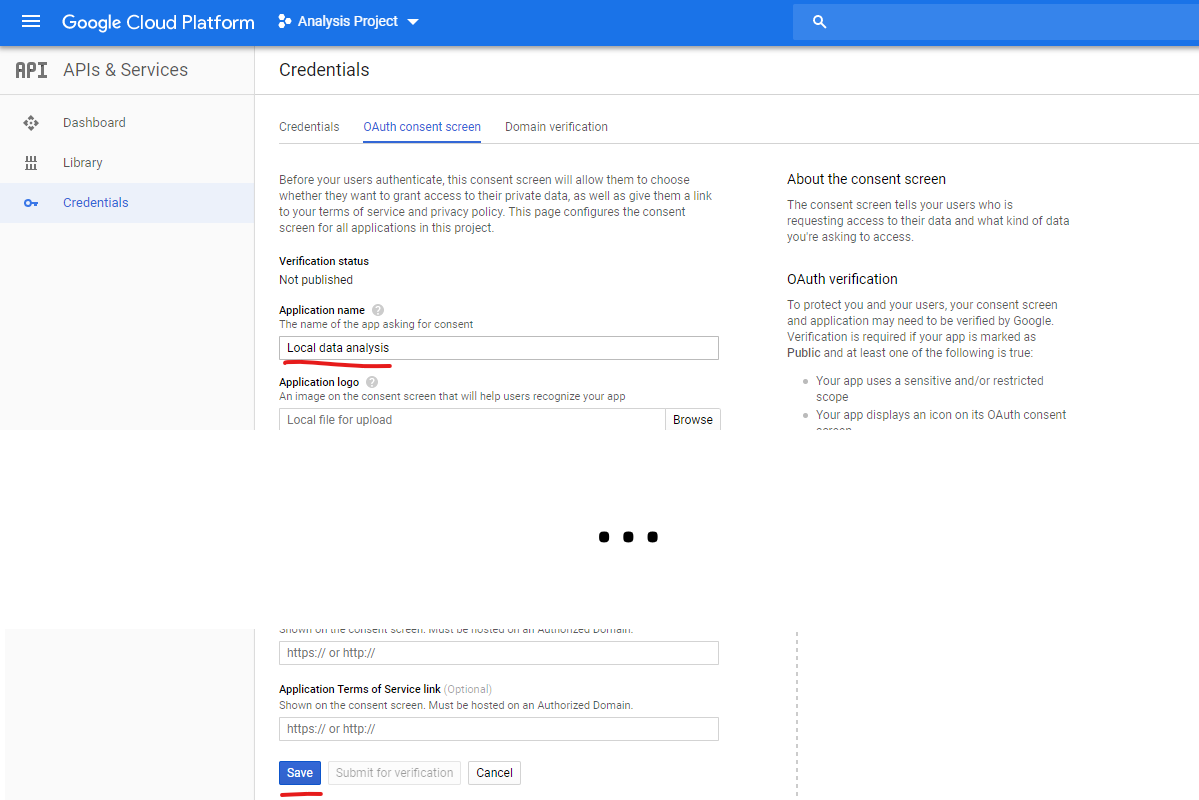
It's going to complain and say we need to set-up the consent screen first. Essentially because we're asking for access to data (even though it's for ourselves), we need to set-up our "App screen".
So open the OAuth consent screen. Set a name and save.
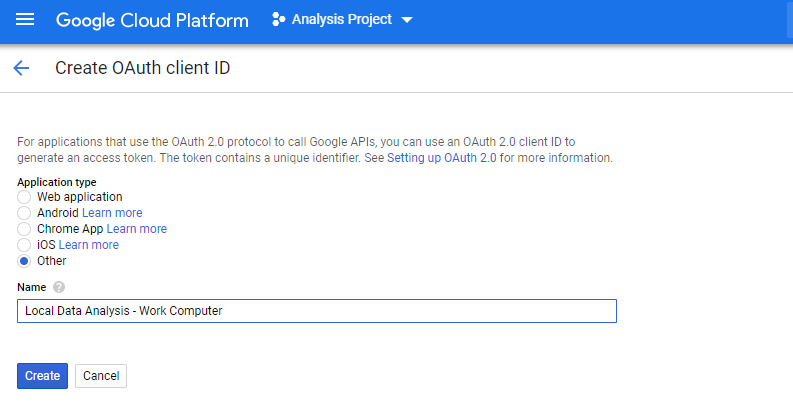
Then we can go back to the first screen and create one. Select "Other" and choose a name.
I usually put the purpose I'm using it for, plus the computer/computers I'll use it on.
Then we'll get this prompt, which we'll just OK without doing anything.
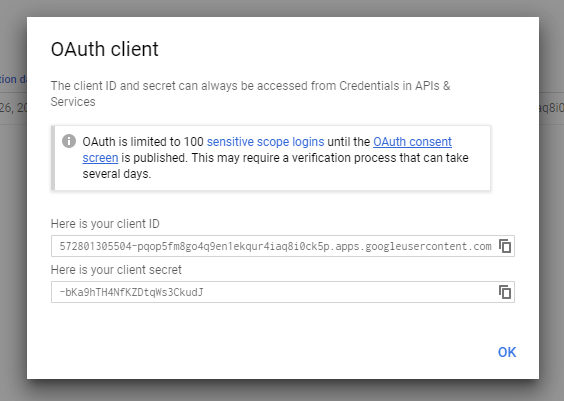
Then we'll download it from the main screen.
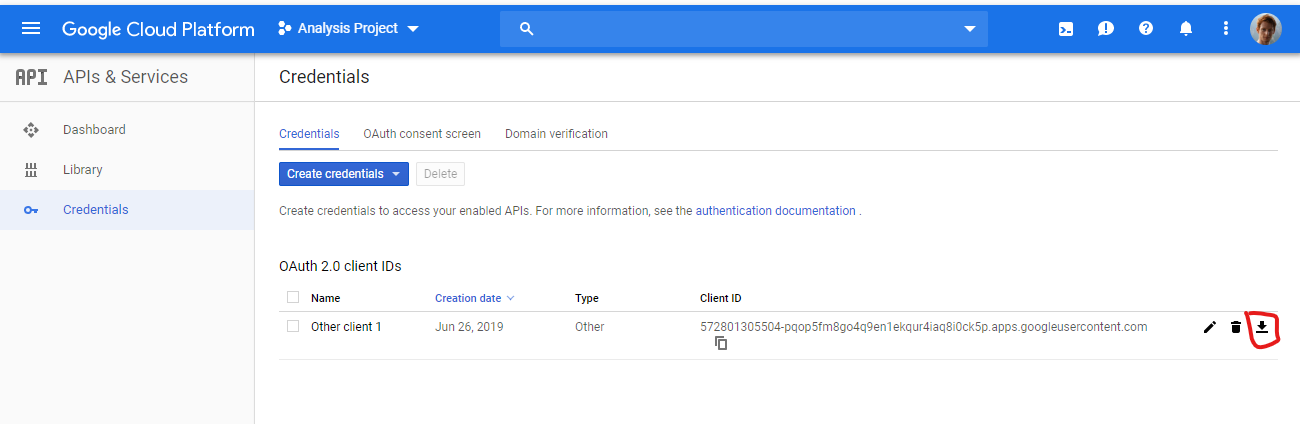
Put this somewhere sensible because we'll need to reference it in our code!
7. Customise our code
Now jump back to our Jupyter notebook and we're going to need to customise a couple things.
The notebook has all these instructions in, so now you can follow along there.
I'm interested in the code
If you're interested in the code, see the Github.
Initially Duncan Morris (Founder & Chairman of Distilled and all-round excellent guy), put this together as a CLI tool years ago.
In the intervening years I ruined his beautiful code to fit my own workflows, while I was learning to code and finally got around to publishing it.
I would not use it in production. It is however useful to analysis.
I wanted to know all the extra details about cardinality
Hello curious person. You want too much detail?
If we're talking about raw queries, you get 1 million rows and that's it.
If we're talking about pre-aggregated tables then it gets a little fiddly:
- GA calculates 50K rows per day (free) or 75K rows per day (premium).
- Then if you ask for a long date range (it's unclear what that is) GA then applies a second filter over the top of that where it goes in 4 day blocks and only selects the top 100K for free and 150K for premium.
I.e.:
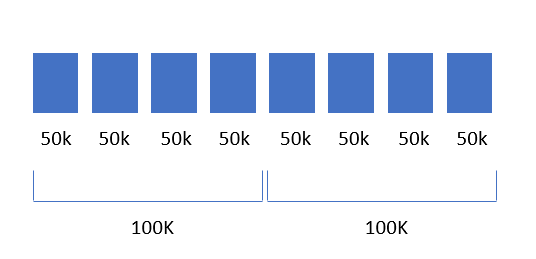
Because these buckets are daily (or blocks of 4 days), it's possible that pages which roll into (other) in one block, don't roll into (other) in the next block and so you could end up with pages which have sessions split across (other) and non-other.
If you want even
Hoorah. Questions?
And we're off to the races! We've got GA data and lots of it.
If you've got any issues, post them in comments and I'll do my best to get you sorted with everything.
